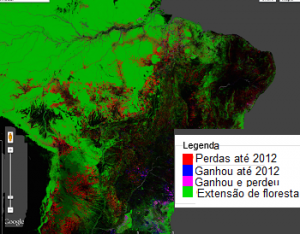
Interactive map shows deforestation
The map developed by researchers at the University of Maryland, USA, shows the evolution of global deforestation data since 2000, the Global Forest Change.
The application is available online for free, and the data on the map of Brazil clearly show that deforestation advances in the Midwest, Amazon, Pará and northeastern.
Data were collected from 350,000 images collected by the Landsat 7 and the data of the largest deforestation include Malaysia, Indonesia, Paraguay and Angola.
According to Matthew Hansen, Maryland professor who heads the project: “This is the first map of forest change that is consistent globally, and also under the relevant local aspect”, and hopefully an awareness overall.
The world can be seen as a whole in many ways, is a society-world.


